Raman microscopy is an advanced analytical technique that integrates Raman spectroscopy with optical microscopy to enable spatially resolved chemical characterization of materials. It allows researchers to obtain molecular-level information from microscopic regions, often down to sub-micron spatial resolution, without requiring extensive sample preparation.
The method is based on the Raman effect. Raman effect is a light-scattering phenomenon that provides insight into molecular vibrations, chemical composition, crystallinity, and molecular interactions. Raman microscopy has become indispensable across disciplines such as materials science, biology, pharmaceuticals, geology, and nanotechnology due to its non-destructive nature and high specificity.
Raman microscopy is a powerful, versatile analytical tool that provides detailed chemical and structural information at microscopic scales. Its non-invasive nature, combined with high specificity and spatial resolution, makes it indispensable in modern research and industrial applications. Despite limitations such as weak signal intensity and fluorescence interference, ongoing technological advancements continue to expand its capabilities and accessibility.
Historical background of Raman microscopy
The foundation of Raman microscopy lies in the discovery of the Raman effect in 1928 by the Indian physicist C. V. Raman. While investigating the interaction of light with matter, Raman observed that a small fraction of scattered light changed in wavelength after passing through transparent materials. This phenomenon, known as inelastic scattering, demonstrated that incident photons could exchange energy with molecular vibrations. The discovery provided a completely new method for probing molecular structure and chemical composition. For this groundbreaking contribution, Raman was awarded the 1930 Nobel Prize in Physics, becoming the first Asian scientist to receive a Nobel Prize in the sciences.
In the early decades following its discovery, Raman spectroscopy had limited practical application because Raman scattering is inherently weak, with only a tiny proportion of photons undergoing inelastic scattering. Early Raman instruments relied on mercury arc lamps as excitation sources and photographic plates for detection. These systems required very long exposure times, often extending to several hours, and produced spectra with relatively poor sensitivity and resolution.
A major breakthrough occurred in the 1960s with the invention and widespread adoption of the laser. Lasers provided intense, monochromatic, and coherent light sources that significantly enhanced Raman signal intensity and improved spectral quality. This advancement transformed Raman spectroscopy into a practical analytical technique for scientific research. Further technological progress occurred during the 1970s and 1980s with the introduction of high-quality diffraction gratings, sensitive photomultiplier tubes, and especially charge-coupled device (CCD) detectors. CCD detectors dramatically improved signal detection, reduced acquisition time, and enabled digital spectral analysis. The integration of Raman spectrometers with optical microscopes subsequently led to the development of Raman microscopy, allowing researchers to obtain detailed molecular and chemical information from microscopic regions of samples with high spatial resolution.
Fundamental principles of Raman scattering
Interaction of Light with Matter
When monochromatic light (typically from a laser) interacts with a sample, several processes occur:
- Elastic scattering (Rayleigh scattering): No energy change; scattered photons have the same wavelength.
- Inelastic scattering (Raman scattering): Energy is exchanged with molecular vibrations, resulting in wavelength shifts.
Only about 1 in 10⁶-10⁸ photons undergo Raman scattering, which makes the technique inherently weak.
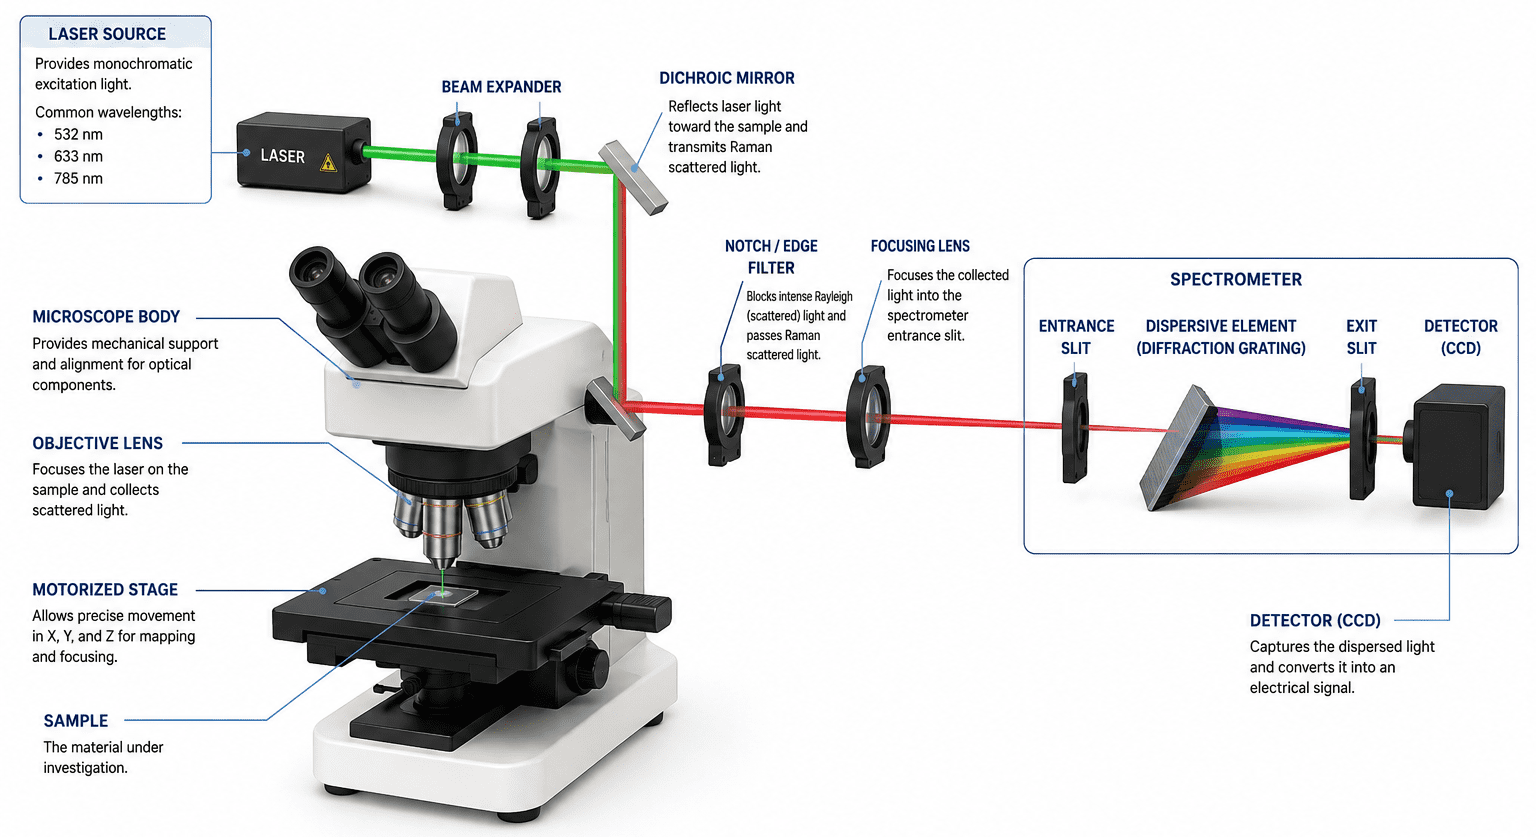
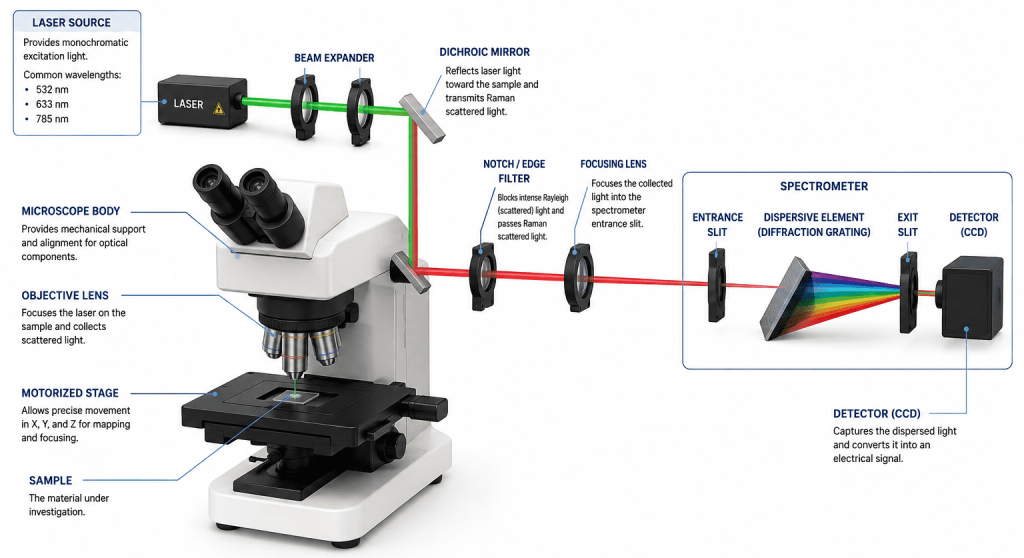
Raman scattering is based on the interaction between electromagnetic radiation and matter at the molecular level. When monochromatic light, usually produced by a laser source, is directed onto a sample, the photons interact with the atoms and molecules present in the material. Most photons are scattered immediately after interaction, but the nature of this scattering can differ depending on whether energy transfer occurs between the photons and the molecular vibrational states. Raman microscopy integrates a laser source, optical microscope, and spectrometer to probe molecular vibrations at microscopic scales. The laser is focused onto the sample via a microscope objective, and scattered light is collected, filtered to remove Rayleigh scattering, and analyzed by a spectrometer. This configuration enables chemical identification and spatial mapping through characteristic Raman spectral signatures. (Figure 1).
The majority of scattered photons undergo elastic scattering, known as the Rayleigh scattering process. In Rayleigh scattering, there is no exchange of energy between the incident photon and the molecule. As a result, the scattered photons retain the same frequency, wavelength, and energy as the incident light. Rayleigh scattering is typically very intense and constitutes most of the scattered radiation collected from the sample.
A much smaller fraction of photons undergoes inelastic scattering, which forms the basis of Raman spectroscopy. In this process, energy is exchanged between the incident photons and the vibrational or rotational energy levels of the molecules. Consequently, the scattered photons emerge with energies different from that of the incident light, producing a shift in wavelength known as the Raman shift. If the molecule gains energy from the photon, the scattered photon loses energy, resulting in Stokes scattering. Conversely, if the molecule loses energy to the photon, the scattered photon gains energy, producing anti-Stokes scattering.
Raman scattering is an inherently weak phenomenon because only approximately one in every 10⁶ to 10⁸ incident photons undergoes Raman scattering. This weak signal necessitates the use of highly sensitive detectors, powerful laser sources, and efficient optical systems in Raman microscopy instruments. Despite its low intensity, Raman scattering provides highly specific molecular and structural information, making it an exceptionally valuable analytical technique.
Types of Raman scattering
Raman scattering is classified into two principal types based on the direction of energy transfer between the incident photon and the molecule: Stokes scattering and Anti-Stokes scattering. These arise because molecules can either gain or lose vibrational energy during interaction with incident laser light (Figure 2). The two types of Raman scattering are: stokes scattering and anti-stokes scattering.
1. Stokes Scattering
Stokes scattering is the most common and most intense form of Raman scattering. In this process, the incident photon transfers part of its energy to the molecule. As a result, the scattered photon possesses lower energy and therefore a longer wavelength than the incoming photon. This occurs when the molecule is initially in its ground vibrational state and becomes excited to a higher vibrational energy level after interaction with the light. Because most molecules at room temperature exist in the ground vibrational state, Stokes transitions occur more frequently than anti-Stokes transitions. Consequently, Stokes Raman signals are stronger and are typically used for routine Raman spectroscopy and Raman microscopy measurements. The Raman peaks observed in the Stokes region provide valuable information about molecular vibrations, chemical bonding, and structural composition of the sample.
2. Anti-Stokes Scattering
In Anti-Stokes scattering, the molecule is already in an excited vibrational state before interaction with the incident photon. During scattering, the molecule transfers energy to the photon, causing the scattered photon to gain energy and shift to a shorter wavelength than the incident light. Since only a small fraction of molecules occupy excited vibrational states at room temperature, Anti-Stokes scattering is much weaker than Stokes scattering. However, the intensity of Anti-Stokes signals increases with temperature because more molecules populate higher vibrational levels. For this reason, Anti-Stokes Raman spectroscopy is particularly useful for temperature determination, thermal mapping, and studying heat generation in materials and biological systems.

Raman shift
The Raman shift (denoted as V) is the fundamental parameter measured in Raman spectroscopy and Raman microscopy (Figure 3). It is defined as the difference in energy between the incident laser photons and the scattered photons after interaction with the molecular vibrations of a sample. Rather than being expressed directly in wavelength units, the Raman shift is conventionally reported in wave numbers (cm⁻¹) because wave numbers are directly proportional to energy and provide a convenient scale for vibrational spectroscopy.
The Raman shift is mathematically represented as:
Change in V = Vincident – Vscattered
where:
- Vincident = wavenumber of the incident laser light
- Vscattered = wavenumber of the scattered light
A positive Raman shift corresponds to Stokes scattering, while a negative shift corresponds to anti-Stokes scattering. Importantly, the Raman shift is independent of the excitation wavelength used, meaning that the same molecule produces Raman bands at identical shift positions regardless of the laser source. Each molecular bond and functional group generates characteristic Raman shifts, making Raman spectra highly specific molecular “fingerprints” useful for compound identification and structural analysis.
Molecular vibrations in Raman microscopy
Raman spectroscopy probes vibrational modes. A vibration is Raman-active if it involves a change in polarizability of the molecule. These vibrational modes includes:
- Stretching (symmetric and asymmetric)
- Bending (scissoring, rocking, wagging, twisting)
Molecular vibrations are the fundamental basis of Raman microscopy because the technique directly measures how molecular bonds respond to incident electromagnetic radiation. When a molecule is irradiated with a laser, its atoms oscillate about their equilibrium positions in quantized vibrational modes. These vibrations are broadly classified into stretching and bending motions. Stretching vibrations involve periodic changes in bond length and can be either symmetric stretching, where bonds expand and contract uniformly, or asymmetric stretching, where bonds change length in opposite directions.
Bending vibrations involve changes in bond angles rather than bond lengths and include several subtypes such as scissoring (in-plane angle decrease/increase between two bonds), rocking (in-plane movement of atoms in the same direction), wagging (out-of-plane movement where atoms move in the same direction), and twisting (out-of-plane movement where atoms move in opposite directions).
For a vibrational mode to be detectable in Raman spectroscopy, it must be Raman-active, meaning it produces a change in the molecule’s polarizability tensor during vibration. Polarizability refers to how easily the electron cloud around a molecule is distorted by an external electric field such as that of an incident laser. Vibrations that significantly alter this electron cloud distribution lead to measurable inelastic scattering, producing characteristic Raman shifts that serve as molecular fingerprints (Figure 3).

Instrumentation of Raman microscopy
A Raman microscope is a highly integrated optical instrument that combines the principles of Raman spectroscopy with high-resolution optical microscopy. Each component plays a specific role in excitation, collection, filtering, dispersion, and detection of Raman-scattered photons. The overall performance sensitivity, spatial resolution, spectral accuracy, and imaging capability depends on the precise coordination of these subsystems.
The Raman microscope is a carefully engineered optical system in which each component laser, microscope optics, filtering elements, spectrometer, detector, and confocal assembly plays a crucial role in maximizing weak Raman signals while maintaining spatial precision. The interplay between these components determines the instrument’s sensitivity, resolution, and applicability across scientific fields ranging from materials characterization to biological imaging.
A Raman microscope integrates several components:
1. Laser source
The laser is the excitation backbone of Raman microscopy, providing monochromatic, coherent light that interacts with molecular vibrations in the sample. The choice of laser wavelength is critical because it directly influences Raman scattering efficiency, fluorescence background, and sample damage.
Common laser wavelengths include:
- UV lasers (e.g., 244 nm): These can significantly enhance Raman scattering due to the λ⁻⁴ dependence of Raman intensity. However, UV excitation often increases photochemical damage and is less commonly used in biological samples.
- Visible lasers (e.g., 488 nm, 532 nm, 633 nm): These are widely used in standard Raman systems. The 532 nm laser often provides strong Raman signals but may induce fluorescence in organic or biological samples. The 633 nm line offers a balance between signal strength and fluorescence suppression.
- Near-infrared (NIR) lasers (e.g., 785 nm, 1064 nm): These are preferred for fluorescence-prone samples such as biological tissues, polymers, and pigments. While fluorescence is significantly reduced, Raman scattering intensity is weaker, requiring longer acquisition times or more sensitive detectors.
Shorter wavelengths produce stronger Raman scattering but higher fluorescence background, while longer wavelengths reduce fluorescence but also decrease Raman signal intensity and spatial resolution efficiency.
2. Optical microscope
The optical microscope provides the spatial framework for Raman microscopy, enabling precise focusing of the laser beam and visualization of the sample. This component allows Raman spectroscopy to transition from bulk analysis to micro-scale chemical imaging.
- High numerical aperture (NA) objectives are essential because they determine both light-gathering efficiency and spatial resolution.
- The laser is tightly focused onto a diffraction-limited spot, often around ~1 µm or below, depending on wavelength and NA.
- The same objective lens is typically used for both excitation and collection of scattered light (backscattering geometry), ensuring alignment and efficiency.
3. Beam delivery and collection optics
This subsystem directs the laser beam to the sample and efficiently collects scattered photons.
- Dichroic mirrors are wavelength-selective optical elements that reflect the laser excitation light toward the sample while transmitting the weaker Raman-scattered light back toward the detector pathway.
- Beam steering optics ensure precise alignment of the laser spot with the microscope focal plane.
- After scattering, optical filters are critical:
- Notch filters remove the intense Rayleigh (elastic) scattering line while transmitting Raman-shifted light around it.
- Edge filters block either Stokes or anti-Stokes side of the spectrum, depending on configuration.
These optical components are essential because Raman signals are extremely weak compared to elastic scattering.
4. Spectrometer
The spectrometer is responsible for converting the collected Raman light into a measurable spectrum.
- It typically uses a diffraction grating, which disperses incoming photons according to wavelength.
- The dispersed light is spatially separated so that each wavelength corresponds to a different position on the detector.
- The spectral resolution depends on the grating density (grooves/mm), focal length of the spectrograph, and slit width.
High-resolution spectrometers can resolve subtle vibrational differences, which is critical for distinguishing chemically similar compounds or polymorphic forms.
5. Detector
The detector converts photons into digital signals for analysis. The most commonly used detector is a:
- Charge-Coupled Device (CCD)
Key features of the CCD are:
- Extremely sensitive to low photon flux, essential because Raman scattering is inherently weak.
- Capable of capturing entire spectra simultaneously (multi-channel detection).
- Often cooled (e.g., thermoelectric cooling) to reduce thermal noise and improve signal-to-noise ratio.
For near-infrared excitation (e.g., 1064 nm), specialized detectors such as InGaAs arrays may be used instead of standard silicon CCDs.
6. Confocal system
The confocal arrangement is what transforms a standard Raman spectrometer into a true Raman microscope with 3D spatial resolution.
- A pinhole aperture is placed in the optical path before the detector.
- This pinhole blocks out-of-focus light, allowing only light from the focal plane to reach the spectrometer.
- As a result, Raman signals are spatially filtered, significantly improving image contrast and axial resolution.
This configuration enables:
- Depth profiling (z-axis scanning through layered samples)
- 3D chemical imaging
- Reduction of background signals from substrates or adjacent layers
The confocal system is particularly important in biological tissues, multilayer materials, and heterogeneous samples where spatial specificity is essential.
Spatial resolution in Raman microscopy
Spatial resolution in Raman microscopy is fundamentally governed by the optical diffraction limit, which defines the smallest distance at which two spatial features can be distinguished. This limit is commonly expressed by the Abbe equation:
d = 0.61λ / NA
where d is the lateral resolution, λ is the excitation laser wavelength, and NA is the numerical aperture of the objective lens. Because Raman microscopy typically uses visible to near-infrared lasers, the achievable lateral spatial resolution is usually in the range of approximately 200-500 nm, depending on the wavelength and objective used. Shorter wavelengths and higher NA objectives improve resolution.
In the axial (depth) direction, resolution is inherently poorer due to elongated point spread functions, but confocal Raman microscopy significantly improves sectioning capability by rejecting out-of-focus light using a pinhole. This results in an axial resolution typically between 500 nm and 1 µm. Together, these constraints define the 3D spatial resolving power of Raman imaging systems.
Raman imaging and mapping
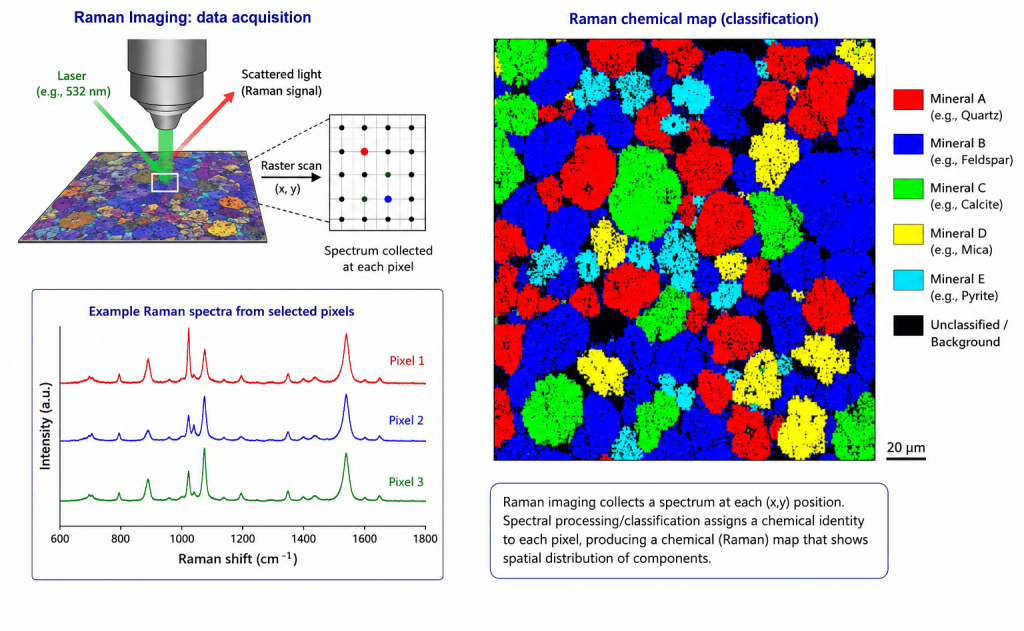
Raman imaging and mapping extend the capabilities of point-based Raman spectroscopy by providing spatially resolved chemical information across a sample. Instead of analyzing a single location, these approaches build up a detailed picture of molecular distribution, composition, and heterogeneity. Raman imaging strategies transform spectroscopy from a point measurement tool into a powerful chemical imaging platform capable of revealing detailed spatial and molecular information across complex systems (Figure 4).
Key modes of Raman analysis are as follows:
- Point spectroscopy represents the most basic mode of Raman analysis. Here, a single spectrum is acquired from a precisely defined microscopic location on the sample. This approach is useful for identifying the chemical composition of a specific feature, such as a particle, cell region, or defect site. However, it provides no direct spatial context beyond that single measurement.
- Line mapping improves spatial coverage by collecting spectra sequentially along a predefined line across the sample surface. This produces a one-dimensional chemical profile, allowing researchers to observe how composition changes across an interface, gradient, or boundary. It is commonly used to study layered materials, diffusion processes, or compositional transitions.
- Area mapping (chemical imaging) extends this concept into two dimensions. Spectra are collected over a grid of points across a selected region, producing a full spatial map of chemical information. Each spectrum corresponds to a pixel in the resulting image, where intensity variations of specific Raman bands reveal the distribution of molecular species. This technique is particularly powerful for identifying phase separation, contamination, or spatial organization in heterogeneous samples.
- Hyperspectral data acquisition represents the most information-rich form of Raman imaging. In this case, every pixel in the mapped region contains a complete Raman spectrum rather than a single intensity value. This generates a three-dimensional dataset (x, y, and spectral dimension), often referred to as a hyperspectral cube. Because these datasets are highly complex, they are typically analyzed using multivariate statistical techniques such as Principal Component Analysis (PCA) or cluster analysis. These methods reduce dimensionality, highlight patterns, and enable the identification of chemically distinct regions without prior assumptions.
Variants of Raman microscopy
Raman microscopy has evolved into multiple specialized variants designed to overcome the inherent limitations of conventional Raman scattering, particularly its weak signal intensity, susceptibility to fluorescence interference, and limited spatial resolution. Each variant enhances specific aspects such as sensitivity, spatial resolution, speed, or molecular selectivity. Raman microscopy variants extend the technique’s applicability from nanoscale material characterization to real-time biological imaging, significantly broadening its scientific and technological impact.
These variants of Raman microscopy are as follows:
1. Confocal Raman microscopy
Confocal Raman microscopy integrates a confocal optical arrangement into a Raman microscope, significantly improving spatial resolution and optical sectioning capability. The key feature is the use of a pinhole aperture placed in a conjugate focal plane, which selectively blocks out-of-focus scattered light. This ensures that only Raman signals originating from a well-defined focal volume contribute to the detected spectrum.
The main advantages include:
- Improved lateral and axial resolution, enabling more precise spatial mapping
- Enhanced depth discrimination, allowing for subsurface analysis
- Capability for 3D Raman imaging (z-stack reconstruction) by scanning at different focal depths
This technique is widely used in materials science and biology where spatial heterogeneity is critical.
2. Surface-Enhanced Raman Spectroscopy (SERS)
Surface-Enhanced Raman Spectroscopy relies on the dramatic amplification of Raman signals when molecules are adsorbed onto or near nanostructured metallic surfaces, typically gold or silver nanoparticles. The enhancement arises primarily from localized surface plasmon resonance (LSPR), where conduction electrons in the metal collectively oscillate in response to incident light, producing highly intensified electromagnetic fields.
Key features of SERS are:
- Signal enhancement factors ranging from 10⁶ to 10¹⁴
- Ability to detect single molecules in extreme cases
- Strong sensitivity to trace analytes
SERS is extensively applied in:
- Biomedical diagnostics (e.g., biomarkers, pathogens)
- Environmental trace detection
- Chemical sensing and forensic analysis
3. Tip-Enhanced Raman Spectroscopy (TERS)
Tip-Enhanced Raman Spectroscopy combines Raman microscopy with scanning probe techniques such as atomic force microscopy (AFM) or scanning tunneling microscopy (STM). A metallic (often gold or silver-coated) sharp tip is brought extremely close to the sample surface, acting as a nanoscale antenna that concentrates the electromagnetic field.
Key characteristics of TERS are as follows:
- Achieves nanometer-scale spatial resolution, far beyond the diffraction limit
- Enables simultaneous topographical and chemical mapping
- Provides localized signal enhancement at the tip apex
TERS is particularly powerful for studying nanoscale heterogeneity in materials such as graphene, polymers, and biological membranes.
4. Resonance Raman spectroscopy
In resonance Raman spectroscopy, the excitation laser wavelength is tuned to coincide with or lie very close to an electronic absorption band of the analyte. This resonance condition selectively amplifies vibrational modes associated with the chromophore involved in the electronic transition.
Advantages of resonance Raman spectroscopy include:
- Strong enhancement (up to 10²-10⁶ times) of specific vibrational modes
- High molecular selectivity for conjugated systems and pigments
- Reduced background from non-resonant species
It is widely used in the study of biological pigments (e.g., heme proteins, carotenoids) and conjugated polymers.
5. Coherent Raman techniques
Coherent Raman methods involve nonlinear optical processes that generate Raman signals through coherent excitation of molecular vibrations. The two primary techniques are:
- CARS (Coherent Anti-Stokes Raman Spectroscopy)
- SRS (Stimulated Raman Scattering)
In CARS, multiple laser beams interact with the sample to produce a strong anti-Stokes signal, while in SRS, the signal arises from stimulated energy transfer between pump and Stokes beams.
Key advantages of coherent Raman methods are:
- Faster imaging speeds, suitable for live-cell or dynamic processes
- Higher sensitivity compared to spontaneous Raman
- Reduced fluorescence interference, improving signal clarity
These techniques are particularly valuable in biomedical imaging, enabling real-time chemical imaging of living tissues without labeling.
Sample preparation for Raman microscopy
One of the defining advantages of Raman microscopy is its ability to analyze samples with minimal to no preparation, making it highly versatile across biological, chemical, and materials-based applications. Because the technique relies on inelastic light scattering rather than chemical labeling or absorption, it preserves the native state of the sample. Raman microscopy requires careful but minimal preparation, balancing signal quality with sample integrity.
Core advantages of Raman microscopy
- Works across all phases of matter
- Solids: powders, crystals, thin films, polymers, minerals
- Liquids: aqueous solutions, biological fluids, solvents
- Gases: gaseous analytes in controlled chambers or cells
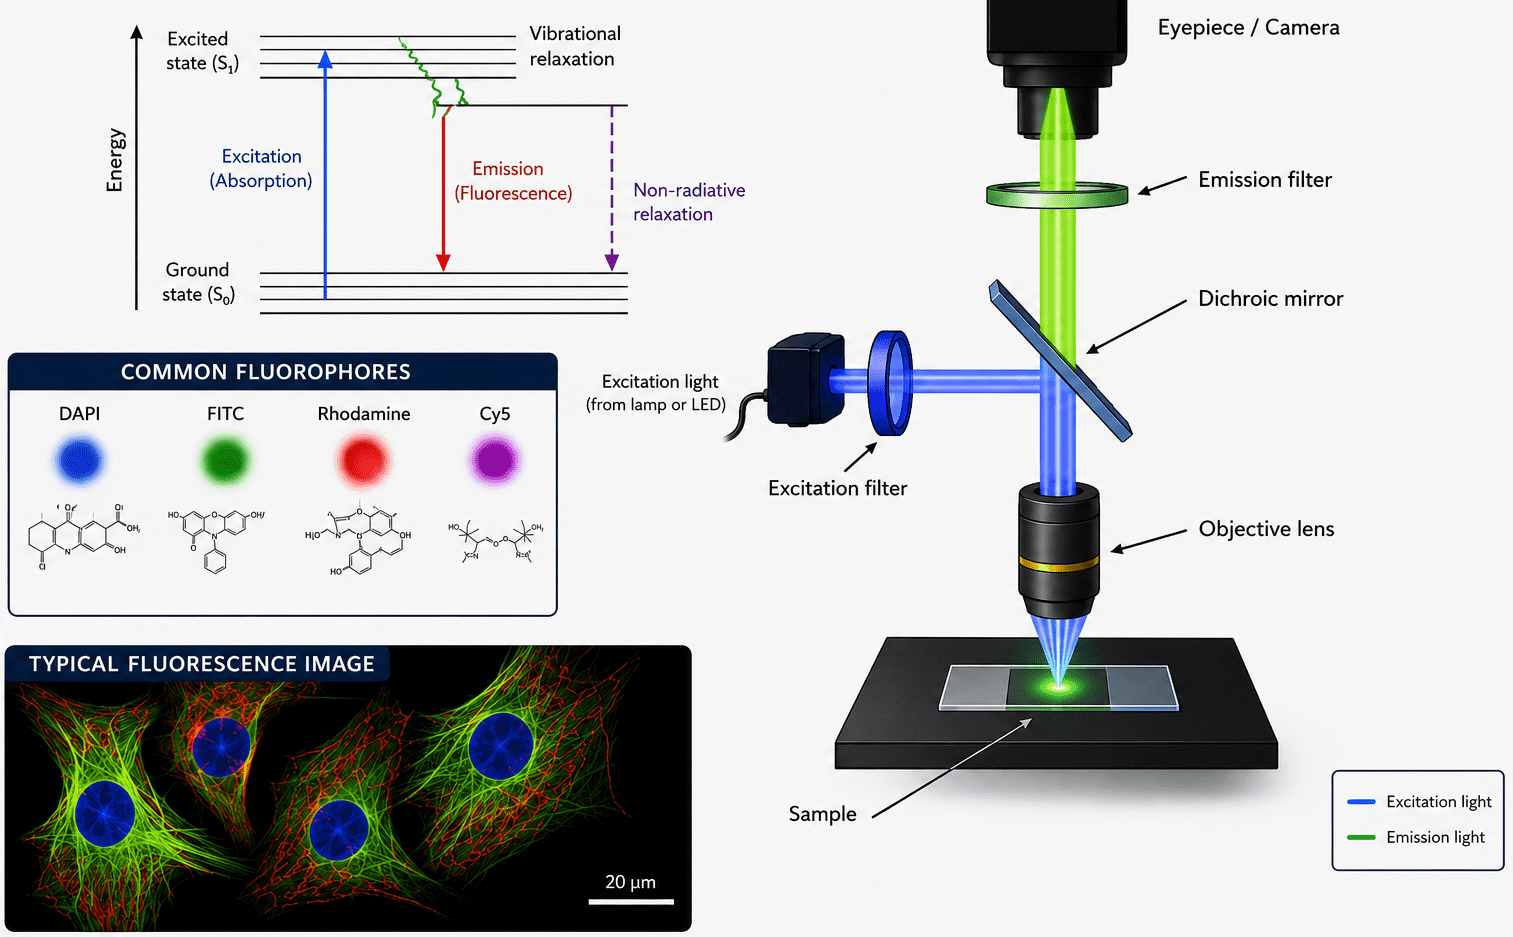
- No staining or labeling required
- Unlike fluorescence microscopy, Raman does not require dyes or fluorophores
- Native molecular vibrations provide intrinsic chemical contrast
- In situ and in vivo compatibility
- Measurements can be performed directly in environmental chambers, reactors, or biological systems
- Enables real-time monitoring of chemical or structural changes
Key preparation considerations
- Fluorescence contamination avoidance
- Biological samples and organic compounds may fluoresce under visible excitation
- This can overwhelm weak Raman signals
- Mitigation strategies include:
- Using longer excitation wavelengths (e.g., 785 nm or 1064 nm)
- Photobleaching prior to measurement
- Selecting non-fluorescent sample regions
- Choice of substrate
- Substrates must have minimal Raman background
- Common options for choice of substrates are:
- Glass (suitable but may contribute weak background signals)
- Quartz (lower background, preferred for spectroscopy)
- Calcium fluoride (CaF₂) or magnesium fluoride (MgF₂) for high-end applications
- Minimizing laser-induced damage
- Excessive laser power can cause heating, photochemical changes, or burning
- Particularly critical for:
- Biological tissues and cells
- Polymers and organic materials
- Mitigation strategies:
- Reduce laser power
- Use shorter acquisition times
- Employ raster scanning or defocused beams
Applications of Raman microscopy
Raman microscopy is a powerful, non-destructive analytical technique that combines Raman spectroscopy with optical microscopy, enabling molecular-level chemical identification with spatial resolution. Its ability to generate detailed chemical maps without extensive sample preparation has made it widely applicable across diverse scientific disciplines as follows:
Materials science
In materials science, Raman microscopy is extensively used for phase identification, allowing researchers to distinguish between different crystalline and amorphous phases based on vibrational fingerprints. It is also employed in stress and strain analysis, where shifts in Raman peak positions reveal lattice deformation in materials such as metals, ceramics, and thin films. Another key application is crystallinity assessment, particularly in polymers and carbon-based materials, where Raman spectra provide insights into ordering and defect density. In semiconductor characterization, Raman microscopy is used to evaluate doping levels, carrier concentration, and thermal effects in materials such as silicon, gallium nitride, and graphene-based devices.
Biological and medical sciences
In biological systems, Raman microscopy enables cell and tissue imaging without the need for fluorescent labels, preserving native biochemical states. It provides detailed information on protein and lipid composition, aiding studies of cellular metabolism and structure. In medical diagnostics, it is increasingly explored for cancer detection, where subtle biochemical differences between healthy and malignant tissues can be identified. Additionally, it is valuable in studying drug-cell interactions, helping to track drug uptake, localization, and biochemical effects at the single-cell level.
Pharmaceuticals
In the pharmaceutical industry, Raman microscopy is used for polymorph identification, ensuring correct crystal forms of active pharmaceutical ingredients (APIs), which directly affect drug efficacy and stability. It also enables visualization of drug distribution in tablets, providing insights into formulation uniformity and excipient interactions. Furthermore, it plays a critical role in quality control, where it is used to verify raw materials, detect contamination, and ensure batch consistency.
Environmental science
Raman microscopy is increasingly applied in environmental monitoring, particularly for microplastics detection, where it can identify polymer types in complex environmental samples. It is also used for pollutant identification, including organic and inorganic contaminants in water and air. In addition, it supports soil and sediment analysis, enabling characterization of mineral composition and tracking of anthropogenic pollutants.
Forensics
In forensic science, Raman microscopy aids in drug identification, even in trace amounts or complex mixtures. It is also widely used for ink and pigment analysis, helping to authenticate documents and detect forgeries. Another critical application is explosives detection, where Raman signatures enable rapid identification of hazardous substances without destroying evidence.
Nanotechnology
In nanotechnology, Raman microscopy is essential for characterizing carbon nanotubes and graphene, providing information on defects, layer number, and electronic properties. It is also used in nanoparticle analysis, enabling assessment of size, composition, and surface modifications, which are crucial for nanomaterial design and application.
References
Zhang, Y., Hong, H., & Cai, W. (2010). Imaging with Raman spectroscopy. Current Pharmaceutical Biotechnology, 11(6), 654–661.
Smith, G. P. S., McGoverin, C. M., Fraser, S. J., & Gordon, K. C. (2015). Raman imaging of drug delivery systems. Advanced Drug Delivery Reviews, 89, 21–41.
Verduijn, J., Degroote, E., & Skirtach, A. G. (2025). Machine learning with label-free Raman microscopy to investigate ferroptosis in comparison with apoptosis and necroptosis. Communications Biology, 8, 218.
Saqib, M., Fan, Y., Hao, R., & Zhang, B. (2021). Optical imaging of nanoscale electrochemical interfaces in energy applications. Nano Energy, 90 (Part A), 106539.
Discover more from Microbiology Class
Subscribe to get the latest posts sent to your email.