
Level of disease
The amount of a particular disease that is usually present in a community is referred to as the baseline or endemic level of the disease. This level is not necessarily the desired level, which may in fact be zero, but rather is the observed level. In the absence of intervention and assuming that the level is not high enough to deplete the pool of susceptible persons, the disease may continue to occur at this level indefinitely. Thus, the baseline level is often regarded as the expected level of the disease.
While some diseases are so rare in a given population that a single case warrants an epidemiologic investigation (e.g., rabies, plague, polio), other diseases occur more commonly so that only deviations from the norm warrant investigation. Sporadic refers to a disease that occurs infrequently and irregularly. Endemic refers to the constant presence and/or usual prevalence of a disease or infectious agent in a population within a geographic area. Hyperendemic refers to persistent, high levels of disease occurrence.
Occasionally, the amount of disease in a community rises above the expected level. Epidemic refers to an increase, often sudden, in the number of cases of a disease above what is normally expected in that population in that area. Outbreak carries the same definition of epidemic, but is often used for a more limited geographic area.
Cluster refers to an aggregation of cases grouped in place and time that are suspected to be greater than the number expected, even though the expected number may not be known. Pandemic refers to an epidemic that has spread over several countries or continents, usually affecting a large number of people. Typical example of a pandemic is the 2019 novel coronavirus disease (COVID-19) that broke out in China in 2019 and spread across the world in 2020 and beyond, causing a lot of economic, social and health crises.
Epidemics occur when an agent and susceptible hosts are present in adequate numbers, and the agent can be effectively conveyed from a source to the susceptible hosts. More specifically, an epidemic may result from:
- A recent increase in amount or virulence of the agent,
- The recent introduction of the agent into a setting where it has not been before,
- An enhanced mode of transmission so that more susceptible persons are exposed,
- A change in the susceptibility of the host response to the agent, and/or
- Factors that increase host exposure or involve introduction through new portals of entry.
The previous description of epidemics presumes only infectious agents, but non-infectious diseases such as diabetes and obesity exist in epidemic proportion in different parts of the world including the U.S.
Epidemic Patterns
Epidemics can be classified according to their manner of spread through a population:
- Common-source epidemic
- Point
- Continuous
- Intermittent
- Propagated epidemic
- Mixed epidemic
- Other epidemics
A common-source outbreak is one in which a group of persons are all exposed to an infectious agent or a toxin from the same source.
If the group is exposed over a relatively brief period, so that everyone who becomes ill does so within one incubation period, then the common-source outbreak is further classified as a point-source outbreak. The epidemic of leukemia cases in Hiroshima following the atomic bomb blast and the epidemic of hepatitis A among patrons of the Pennsylvania restaurant who ate green onions each had a point source of exposure. If the number of cases during an epidemic were plotted over time, the resulting graph, called an epidemic curve, would typically have a steep upslope and a more gradual downslope (a so-called “log-normal distribution”).
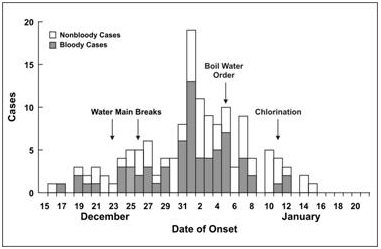
In some common-source outbreaks, case-patients may have been exposed over a period of days, weeks, or longer. In a continuous common-source outbreak, the range of exposures and range of incubation periods tend to flatten and widen the peaks of the epidemic curve (Figure 1). The epidemic curve of an intermittent common-source outbreak often has a pattern reflecting the intermittent nature of the exposure.
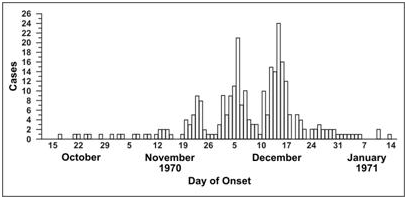
A propagated outbreak results from transmission from one person to another. Usually, transmission is by direct person-to-person contact, as with syphilis. Transmission may also be vehicle-borne (e.g., transmission of hepatitis B or HIV by sharing needles) or vector-borne (e.g., transmission of yellow fever by mosquitoes). In propagated outbreaks, cases occur over more than one incubation period. In Figure 2, note the peaks occurring about 11 days apart, consistent with the incubation period for measles. The epidemic usually wanes after a few generations, either because the number of susceptible persons falls below some critical level required to sustain transmission, or because intervention measures become effective.
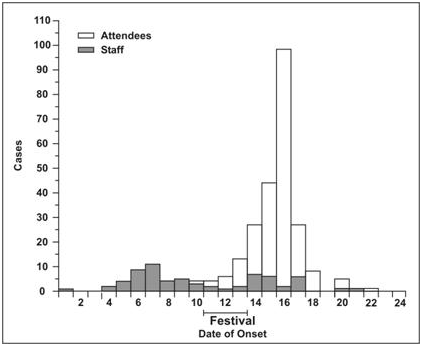
Some epidemics have features of both common-source epidemics and propagated epidemics. The pattern of a common-source outbreak followed by secondary person-to-person spread is not uncommon. These are called mixed epidemics. For example, a common-source epidemic of shigellosis occurred among a group of 3,000 women attending a national music festival (Figure 3). Many developed symptoms after returning home. Over the next few weeks, several state health departments detected subsequent generations of Shigella cases propagated by person-to-person transmission from festival attendees.
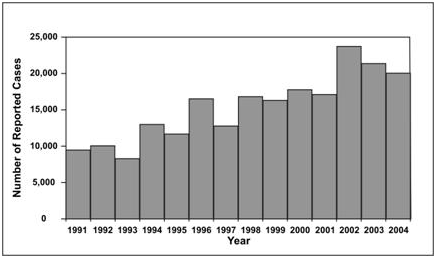
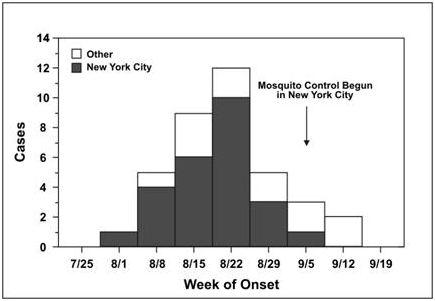
Finally, some epidemics are neither common-source in its usual sense nor propagated from person to person. Outbreaks of zoonotic or vector-borne disease may result from sufficient prevalence of infection in host species, sufficient presence of vectors, and sufficient human-vector interaction. Examples (Figures 4 and 5) include the epidemic of Lyme disease that emerged in the northeastern United States in the late 1980s (spread from deer to human by deer ticks) and the outbreak of West Nile encephalitis in the Queens section of New York City in 1999 (spread from birds to humans by mosquitoes).
Source
Center for Disease Control and Prevention
www.cdc.gov/csels/dsepd/ss1978/lesson1/section11.html
Discover more from Microbiology Class
Subscribe to get the latest posts sent to your email.