Baseline
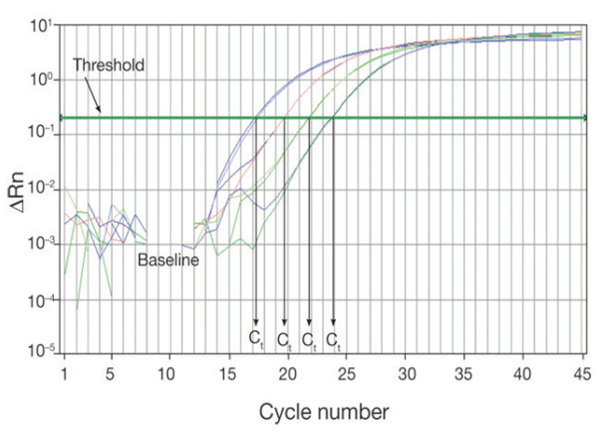
The baseline of the real-time PCR reaction refers to the signal level during the initial cycles of PCR, usually cycles 3 to 15, in which there is little change in fluorescent signal. The low-level signal of the baseline can be equated to the background or the “noise” of the reaction (Figure 1). The baseline in real-time PCR is determined empirically for each reaction, by user analysis or automated analysis of the amplification plot. The baseline should be set carefully to allow accurate determination of the threshold cycle (Ct), defined below. The baseline determination should take into account enough cycles to eliminate the background found in the early cycles of amplification, but should not include the cycles in which the amplification signal begins to rise above background. When comparing different real time PCR reactions or experiments, the baseline should be defined in the same way for each (Figure 1).
Threshold
The threshold of the real-time PCR reaction is the level of signal that reflects a statistically significant increase over the calculated baseline signal (Figure 2). It is set to distinguish relevant amplification signal from the background. Usually, real-time PCR instrument software automatically sets the threshold at 10 times the standard deviation of the fluorescence value of the baseline. However, the position of the threshold can be set at any point in the exponential phase of PCR.
Ct (threshold cycle)
The threshold cycle (Ct) is the cycle number at which the fluorescent signal of the reaction crosses the threshold. The Ct is used to calculate the initial DNA copy number, because the Ct value is inversely related to the starting amount of target. For example, in comparing real-time PCR results from samples containing different amounts of target, a sample with twice the starting amount will yield a Ct one cycle earlier than a sample with twice the number of copies of the target, relative to a second sample, will have a Ct one cycle earlier than that of the second sample. This assumes that the PCR is operating at 100% efficiency (i.e., the amount of product doubles perfectly during each cycle) in both reactions. As the template amount decreases, the cycle number at which significant amplification is seen increases. With a 10-fold dilution series, the Ct values are ~3.3 cycles apart.
Standard curve
A dilution series of known template concentrations can be used to establish a standard curve for determining the initial starting amount of the target template in experimental samples or for assessing the reaction efficiency (Figure 3). The log of each known concentration in the dilution series (x-axis) is plotted against the Ct value for that concentration (y-axis). From this standard curve, information about the performance of the reaction as well as various reaction parameters (including slope, y-intercept, and correlation coefficient) can be derived. The concentrations chosen for the standard curve should encompass the expected concentration range of the target in the experimental samples.

Correlation coefficient (R2)
The correlation coefficient is a measure of how well the data fit the standard curve. The R2 value reflects the linearity of the standard curve. Ideally, R2 = 1, although 0.999 is generally the maximum value.
Y-intercept
The y-intercept corresponds to the theoretical limit of detection of the reaction, or the Ct value expected if the lowest copy number of target molecules denoted on the x-axis gave rise to statistically significant amplification. Though PCR is theoretically capable of detecting a single copy of a target, a copy number of 2–10 is commonly specified as the lowest target level that can be reliably quantified in real-time PCR applications. This limits the usefulness of the y-intercept value as a direct measure of sensitivity. However, the y-intercept value may be useful for comparing different amplification systems and targets.
Exponential phase
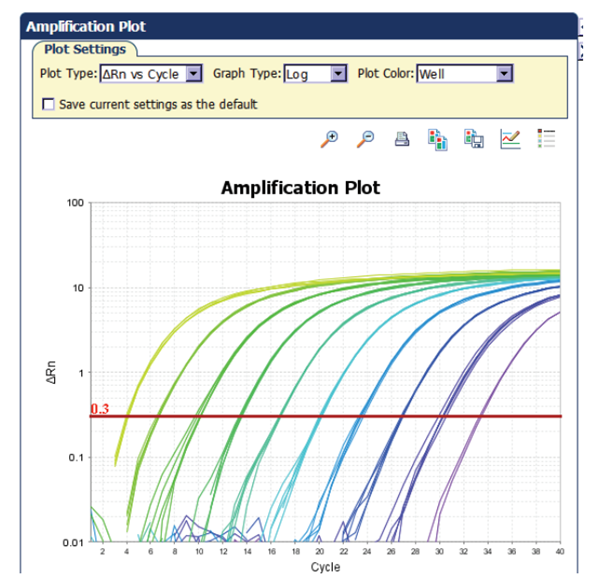
It is important to quantify your real-time PCR reaction in the early part of the exponential phase as opposed to in the later cycles or when the reaction reaches the plateau. At the beginning of the exponential phase, all reagents are still in excess, the DNA polymerase is still highly efficient, and the amplification product, which is present in a low amount, will not compete with the primers’ annealing capabilities. All of these factors contribute to more accurate data.
Slope
The slope of the log-linear phase of the amplification reaction is a measure of reaction efficiency. To obtain accurate and reproducible results, reactions should have an efficiency as close to 100% as possible, equivalent to a slope of –3.32 (see Efficiency, below, for more detail).
Efficiency
A PCR efficiency of 100% corresponds to a slope of –3.32, as determined by the following equation:
Efficiency = 10(–1/slope) –1
Ideally, the efficiency (E) of a PCR reaction should be 100%, meaning the template doubles after each thermal cycle during exponential amplification. The actual efficiency can give valuable information about the reaction. Experimental factors such as the length, secondary structure, and GC content of the amplicon can influence efficiency. Other conditions that may influence efficiency are the dynamics of the reaction itself, the use of non-optimal reagent concentrations, and enzyme quality, which can result in efficiencies below 90%. The presence of PCR inhibitors in one or more of the reagents can produce efficiencies of greater than 110%. A good reaction should have an efficiency between 90% and 110%, which corresponds to a slope of between –3.58 and –3.10.
Dynamic range
This is the range over which an increase in starting material concentration results in a corresponding increase in amplification product. Ideally, the dynamic range for real-time PCR should be 7–8 orders of magnitude for plasmid DNA and at least a 3–4 log range for cDNA or genomic DNA.
Absolute quantification
Absolute quantification describes a real-time PCR experiment in which samples of known quantity are serially diluted and then amplified to generate a standard curve. Unknown samples are then quantified by comparison with this curve.
Relative quantification
Relative quantification describes a real-time PCR experiment in which the expression of a gene of interest in one sample (i.e., treated) is compared to expression of the same gene in another sample (i.e., untreated). The results are expressed as fold change (increase or decrease) in expression of the treated sample in relation to the untreated sample. A normalizer gene (such as β-actin) is used as a control for experimental variability in this type of quantification.
Melting curve (dissociation curve)
A melting curve charts the change in fluorescence observed when double-stranded DNA (dsDNA) with incorporated dye molecules dissociates (“melts”) into single-stranded DNA (ssDNA) as the temperature of the reaction is raised. For example, when double-stranded DNA bound with SYBR® Green I dye is heated, a sudden decrease in fluorescence is detected when the melting point (Tm) is reached, due to dissociation of the DNA strands and subsequent release of the dye. The fluorescence is plotted against temperature (Figure 4A), and then the –ΔF/ΔT (change in fluorescence/change in temperature) is plotted against temperature to obtain a clear view of the melting dynamics (Figure 4B).
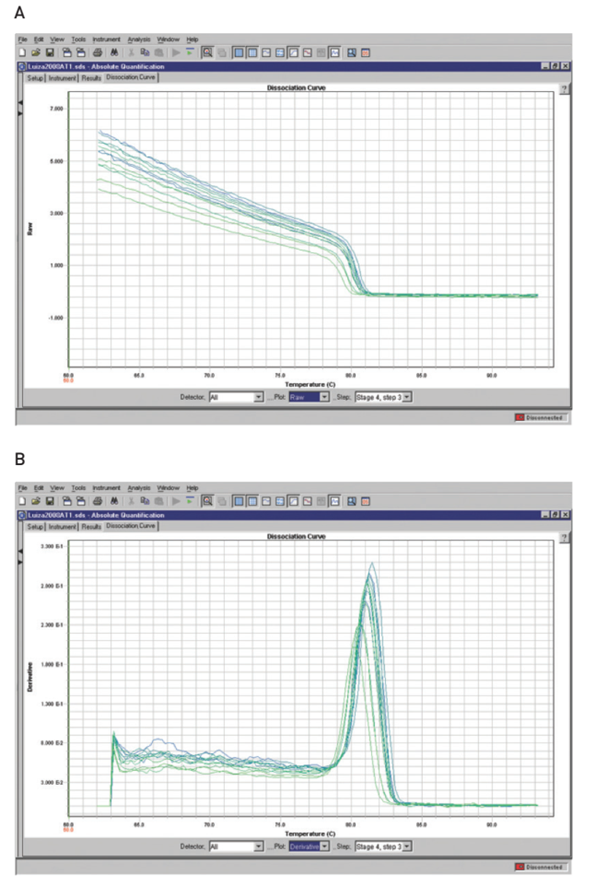
Post-amplification melting-curve analysis is a simple, straightforward way to check real-time PCR reactions for primer-dimer artifacts and to ensure reaction specificity. Because the melting temperature of nucleic acids is affected by length, GC content, and the presence of base mismatches, among other factors, different PCR products can often be distinguished by their melting characteristics. The characterization of reaction products (e.g., primerdimers vs. amplicons) via melting curve analysis reduces the need for time-consuming gel electrophoresis.
The typical real-time PCR data set shown in Figure 5 illustrates many of the terms that have been discussed. Figure 5A illustrates a typical real-time PCR amplification plot. During the early cycles of the PCR reaction, there is little change in the fluorescent signal. As the reaction progresses, the level of fluorescence begins to increase with each cycle. The reaction threshold is set above the baseline in the exponential portion of the plot. This threshold is used to assign the threshold cycle, or Ct value, of each amplification reaction. Ct values for a series of reactions containing a known quantity of target can be used to generate a standard curve.
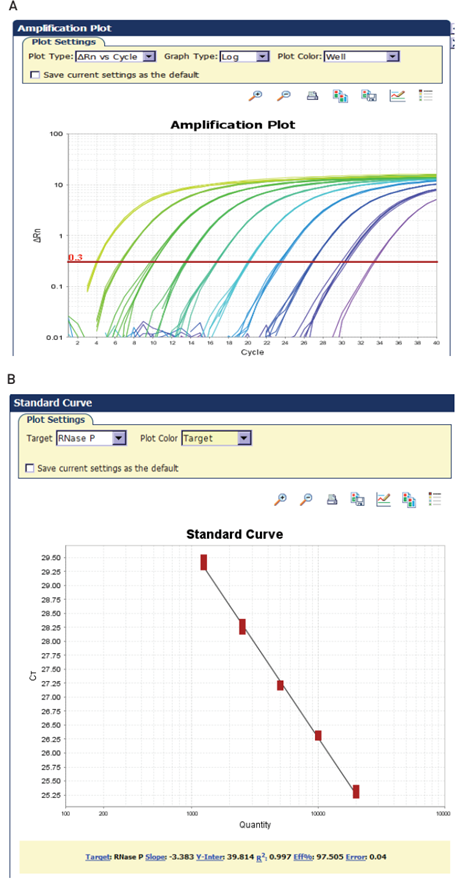
Quantification is performed by comparing Ct values for unknown samples against this standard curve or, in the case of relative quantification, against each other, with the standard curve serving as an efficiency check. Ct values are inversely related to the amount of starting template: the higher the amount of starting template in a reaction, the lower the Ct value for that reaction.
Source
www.lifetechnologies.com
Discover more from Microbiology Class
Subscribe to get the latest posts sent to your email.