Melting curve analysis and detection systems
Melting curve analysis can only be performed with realtime PCR detection technologies in which the fluorophore remains associated with the amplicon. Amplifications that have used SYBR® Green I or SYBR® GreenER™ dye can be subjected to melting curve analysis. Dual-labeled probe detection systems such as TaqMan® probes are not compatible because they produce an irreversible change in signal by cleaving and releasing the fluorophore into solution during the PCR; however, the increased specificity of this method makes this less of a concern.
The level of fluorescence of both SYBR® Green I and SYBR® GreenER™ dyes significantly increases upon binding to dsDNA. By monitoring the dsDNA as it melts, a decrease in fluorescence will be seen as soon as the DNA becomes single-stranded and the dye dissociates from the DNA.
Importance of melting curve analysis
The specificity of a real-time PCR assay is determined by the primers and reaction conditions used. However, there is always the possibility that even well-designed primers may form primer-dimers or amplify a nonspecific product (Figure 1). There is also the possibility when performing qRT-PCR that the RNA sample contains genomic DNA, which may also be amplified. The specificity of the real-time PCR reaction can be confirmed using melting curve analysis. When melting curve analysis is not possible, additional care must be used to establish that differences observed in Ct values between reactions are valid and not due to the presence of nonspecific products.
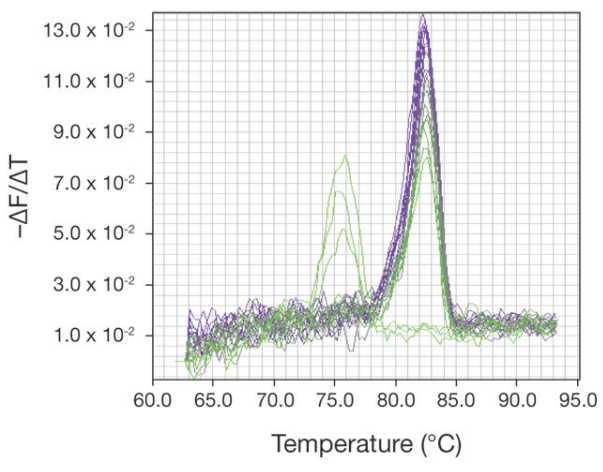
nonspecific products, such as primer-dimers, as shown by the
additional peaks to the left of the peak for the amplified product peaks.
Melting curve analysis and primer-dimers
Primer-dimers occur when two PCR primers (either same-sense primers or sense and antisense primers) bind to each other instead of the target. Melting curve analysis can identify the presence of primer-dimers because they exhibit a lower melting temperature than the amplicon. The presence of primer-dimers is not desirable in samples that contain template, as it decreases PCR efficiency and obscures analysis. The formation of primer-dimers most often occurs in no-template controls (NTCs), where there is an abundance of primer and no template.
The presence of primer-dimers in the NTC should serve as an alert to the user that they may also be present in reactions that
include template. If there are primer-dimers in the NTC, the primers should be redesigned. Melting curve analysis of NTCs can discriminate between primer-dimers and spurious amplification due to contaminating nucleic acids in the reagent components.
How to perform melting curve analysis
To perform melting curve analysis, the real-time PCR instrument can be programmed to include a melting profile immediately following the thermal cycling protocol. After amplification is complete, the instrument will reheat your amplified products to give complete melting curve data (Figure 2). Most real-time PCR instrument platforms now incorporate this feature into their analysis packages.
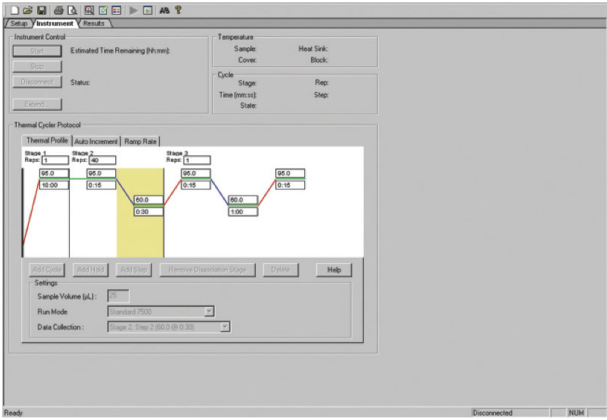
Applied Biosystems® instrument (rapid heating to 94°C to denature the
DNA, followed by cooling to 60°C).
source
www.lifetechnologies.com
Discover more from Microbiology Class
Subscribe to get the latest posts sent to your email.