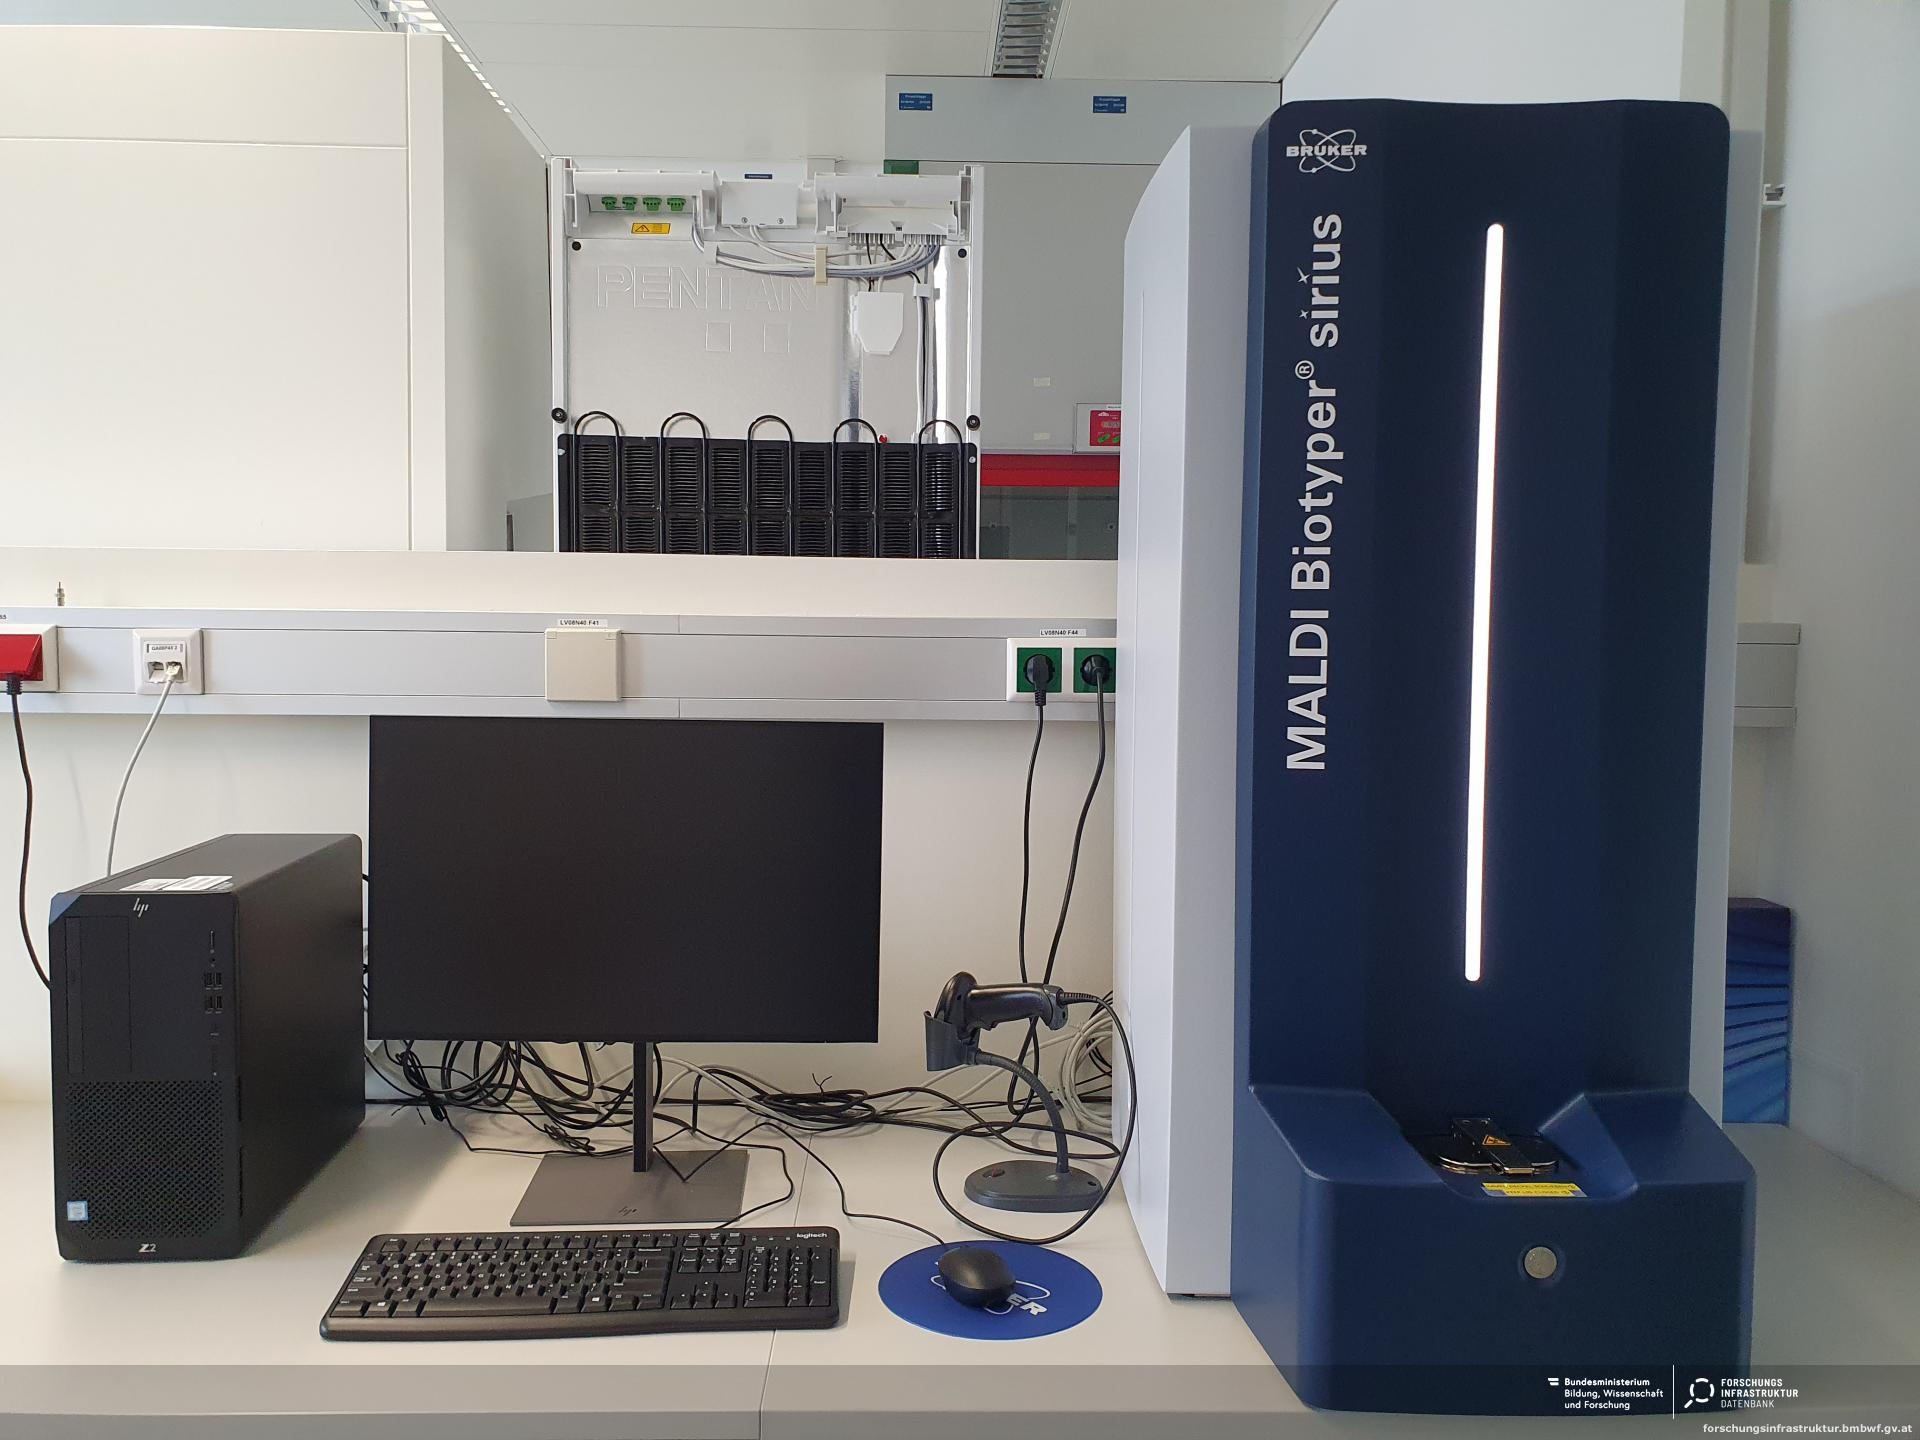
The workflow of Matrix-Assisted Laser Desorption/Ionization-Time of Flight Mass Spectrometry (MALDI-TOF MS) involves several critical steps, from sample preparation to data analysis. Below is a detailed outline:
Sample Preparation
- Culture Preparation:
- For microbial identification, a pure culture of the organism is grown on an appropriate medium.
- Sample Extraction (Optional):
- For some organisms (e.g., Gram-positive bacteria or fungi), an extraction step using organic solvents (e.g., ethanol, formic acid, acetonitrile) may be required to release cellular proteins.
- Matrix Preparation:
- A chemical matrix (e.g., α-cyano-4-hydroxycinnamic acid) is prepared in a volatile solvent to assist in ionization.
- Matrix-Sample Mixing:
- The sample is mixed with the matrix solution or overlaid with it on a MALDI target plate.
- Crystallization:
- The matrix-sample mixture is allowed to dry, forming a crystalline matrix.
Sample Loading
- The prepared MALDI target plate is loaded into the MALDI-TOF MS instrument under vacuum conditions.
Laser Desorption/Ionization
- A laser beam (usually UV) irradiates the matrix-sample spot, causing the matrix to absorb energy and desorb.
- The matrix transfers energy to the analyte molecules (e.g., proteins), causing ionization without fragmentation.
Ion Acceleration
- The generated ions are accelerated through an electric field into the TOF (Time-of-Flight) tube.
Mass Analysis in TOF Tube
- Ions travel through the TOF tube based on their mass-to-charge ratio (m/z).
- Smaller ions travel faster than larger ones, allowing their mass to be determined by measuring their time of flight.
Detection
- Ions are detected at the end of the TOF tube, producing a mass spectrum.
- The spectrum consists of peaks corresponding to the m/z of the ions, primarily representing ribosomal and other conserved proteins for microbial identification.
Data Analysis
- The generated mass spectrum is compared to a reference database (e.g., Bruker Biotyper, VITEK MS).
- Matching spectral profiles enable identification of the organism, often at the species or genus level.
- For non-biological samples, spectral data may be interpreted for molecular structure or compound analysis.
Applications
- Microbial Identification: Rapid identification of bacteria, fungi, and other microorganisms.
- Protein Analysis: Analysis of peptides and proteins in various samples.
- Clinical Diagnostics: Identification of pathogens in clinical samples.
- Biomarker Discovery: Detection of disease-specific proteins.
- Quality Control: Authentication of products in food and pharmaceutical industries.
Interpretation of MALDI-TOF MS result
Mass Spectrum Analysis
- The mass spectrum is a graphical representation of ion intensities (y-axis) versus the mass-to-charge ratio (m/z) (x-axis).
- Each peak corresponds to a specific protein or molecule. For microbial identification, the peaks primarily represent ribosomal and other conserved proteins.
- The pattern of peaks forms a unique spectral fingerprint for the analyte.
Database Matching
- The spectral fingerprint is compared to a reference database containing pre-recorded spectra of known organisms or compounds.
- Algorithms (e.g., cross-correlation, peak matching) analyze the similarity between the sample spectrum and the database spectra.
For Microbial Identification:
- The database assigns a log score value or confidence score to indicate how closely the sample spectrum matches a database entry.
- Scores often fall into these ranges:
- High Confidence Match (e.g., ≥2.0 for Bruker Biotyper):
- The sample is identified with high confidence, typically at the species level.
- Moderate Confidence Match (e.g., 1.7–1.99):
- The sample may be identified at the genus level, but species-level identification is uncertain.
- Low Confidence Match (e.g., <1.7):
- The match is weak or ambiguous. The organism may not be in the database, or the sample quality may be poor.
For Compound Analysis:
- The detected masses are matched to known molecular weights or fragmentation patterns of compounds in a library.
- Unknown peaks may require additional analysis, such as de novo structure elucidation.
Report Generation
- Once identified, the result is presented in a report, including:
- Organism Name or Compound Identity: Based on the highest match.
- Confidence Score or Log Score: To indicate reliability.
- Spectral Overlay (Optional): Showing the comparison between the sample and database spectra.
Key Considerations
- Database Quality: Results depend on the comprehensiveness of the database. A missing reference may lead to a “no match” result.
- Peak Quality: Poor sample preparation, contamination, or mixed cultures can distort the spectrum.
- Expert Validation: In some cases, experts may need to manually review the spectrum, especially for rare or atypical organisms.
Discover more from Microbiology Class
Subscribe to get the latest posts sent to your email.


